
What are fractals?
In mathematics, a fractal is a geometric shape created typically by a mathematical function. They contain detailed structures at arbitrarily small scales, usually having a fractal dimension strictly exceeding the topological dimension. Many fractals appear similar at various scales.
The most popular fractal known by most people would be the Mandelbrot set.

Mandelbrot Set Algorithm C Code
Basic Mandelbrot Set Algorithm
// Mandelbrot Set Drawing Routine.
void Mandelbrot ( )
{
int maxcol = 160; //Maximum number of pixel columns to display
int maxrow = 100; //Maximium number of pixel rows to display.
int max_colors = 255; //Maximum colors to display
int max_it = 256; //Maximum number of iterations.
int max_size =4;
float PMAX=1.75, PMIN=-1.75, QMAX=1.5, QMIN=-1.5;
float P,DP,DQ,X,Y,XS,YS;
int color, row,col;

DP=(PMAX-PMIN)/(maxcol-1);
DQ=(QMAX-QMIN)/(maxrow-1);
for (col=0; col<=maxcol; col++) {
P=PMIN + col*DP;
for (row=0; row<=maxrow; row++) {
X=Y=0.0;
for (color=0; color<=max_it; color++) { XS=X*X; YS=Y*Y; if ((XS+YS) > max_size) break;
Y=2*X*Y+(QMIN+row*DQ);
X=XS-YS+P;
}

_setcolor(color % max_colors);
_setpixel(col,row);
}
}
}
THE ROSE FRACTAL
By plotting certain functions new sets of graphic images can be created.
Let’s look at these two functions
Sketch the rose r = a cos3A
Sketch the rose r = a sin 5A
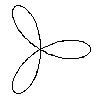
r = ra Cos (3A)
Rose ( 100, 100, 3 , 50);
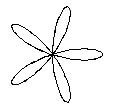
r = ra Cos (5A)
Rose (100, 100, 5, 50);
Rose Fractal Code
//
//Rose()
//
// Draws the Rose diagram of the equation -
// r = ra*cos (n*A);
//Draw a rose equation-
//Paramters - xc,yc : Center of Rose.
// - n : Cos Multiplication Number
// - ra ; Rose Radius.
#define PI 3.14

void Rose(xc,yc,n,ra)
double xc,yc; //centre of Rose
double n; //n value for Equation r = a*cos(n*A)
double ra; //True Rose Radius
  {
int r;
double a;
double x,y;
double F=PI/180;
double xr;
double x1,y1;
//Calculate start point
r = 1;
a = (double) r * F;
xr = ra*cos (n*a); //Equation r=a*cos(N*A)
x1 = xc + xr*cos (a);
y1 = yc + xr*sin (a);
Moveto ( x1, y1); //Move to First Point.

//Draw Rose
for (r = 2; r < 360; r++) {
a = (double) r * F;
xr = ra*cos (n*a); //Equation r=a*cos(N*A)
x = xc + xr*cos (a);
y = yc + xr*sin (a);
Lineto (x, y); //Draw a line from first point to new point.
}
}
LISSAJOUS FIGURES
Lissajous figures are graphs of the parametric equations of
x = a sin w1 t
y = b cos w2 t
These are most usually found in the study of electricity.
By varying the input parameters to the above equation quite interesting results can be achieved.
Below are some examples.
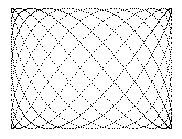
Lissajous ( 200, 200, 20, 4, 7, 3, 11);
x = 4 Sin 7t, y = 3 Cos 11t

Lissajous ( 200, 200, 20, 3, 2, 3, 6);
x = 3 Sin 2t, y = 3 Cos 6t
//
//Lissajous()
//
//Draw a Lissajous graph
//xc,yc = Centre of Lissajous Graph
//Sc = scale factor
//a,w1 = x values for x = a Sin w1 t
//b,W2 = y values for y = b Cos w2 t
//
void lissajous (xc, yc, Sc, a, w1, b, w2)
float xc, yc;
float Sc;
float a,b,w1,w2;
{
float PI = 3.14
float r;
float x,y;
for ( r = 1; r < 5 * PI; r += (PI / 360) ) {
x = xc + Sc * (a * Sin (w1 * r) );
y = yc + Sc * (b * Cos (w2 * r) );
Pixel (x, y);
}
}
Learn more about Fractals
Partner Advertising


